Analytics Extension Guide for Tracking and Optimizing Campaigns
The Instant Popup Builder – Analytics Extension empowers you to measure, understand, and optimize the performance of your popups using real-time data, AI-powered insights, and advanced conversion tracking.
Built with state-of-the-art algorithms and AI-driven logic, this extension helps you analyze what’s happening in your campaigns, identify growth opportunities, and make informed decisions to boost engagement and conversions.
-
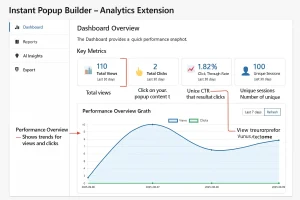
Dashboard Overview
The Dashboard gives you a quick, visual snapshot of your popup performance.
How to Access:
- Go to WordPress Admin → Instant Popup → Analytics.
- Set a date range to compare campaign performance over different time periods.
Key Metrics:
- Total Views – Number of times your popups were displayed.
- Total Clicks – Number of times users interacted with your popup content.
- Click-Through Rate (CTR) – Percentage of views that resulted in clicks.
- Unique Sessions – Number of unique visitors who saw your popups.
Performance Overview Graph:
- Displays trends for views and clicks over a chosen timeframe (7, 14, or 30 days).
-
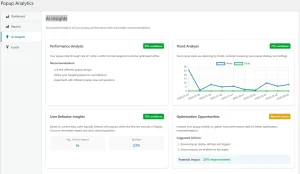
AI Insights
AI Insights automatically evaluates your popup performance and suggests actionable improvements based on your campaign data.
- a) Performance Analysis
- Compares your CTR against industry benchmarks.
- Recommends strategies such as A/B testing, refining targeting, and improving design.
- Provides an AI Confidence Score for recommendations.
- b) Trend Analysis
- Detects performance changes in popup views and clicks.
- Suggests adjustments when a drop in engagement is detected.
- c) User Behavior Insights
- Displays Average Time to Interact and Exit Rate.
- Helps you optimize display timing and messaging clarity.
- d) Optimization Opportunities
- Lists high-impact actions with estimated improvement percentages.
- Prioritizes recommendations with Low, Medium, or High urgency.
-
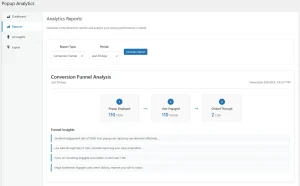
Reports
Generate detailed reports to better understand user behavior and campaign effectiveness. Available report types include:
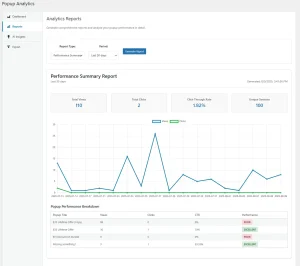
- a) Performance Summary Report
- Shows Total Views, Clicks, CTR, and Unique Sessions for a selected period.
- Includes a trend graph and a popup performance table with ratings:
- Excellent – High CTR
- Poor – Low CTR
Screenshot: Use Analytics – Performance Summary Report.png
- b) Conversion Funnel Analysis
- Visualizes the customer journey:
- Popup Displayed
- User Engaged
- Clicked Through
- Highlights drop-off points.
- Includes Funnel Insights for targeted improvements.
-
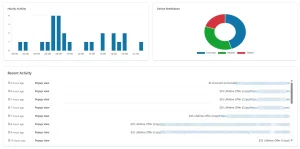
Activity Tracking
Track when and where your popups perform best.
- Hourly Activity – Engagement trends by time of day.
- Device Breakdown – Pie chart of users by Desktop, Mobile, and Tablet.
- Recent Activity – Logs popup views and clicks with timestamps.
-
Using Analytics to Improve Popups
- Double Down on Winners – Replicate high-performing popups.
- Fix Weak Spots – Use AI recommendations to improve low CTR popups.
- Optimize Timing – Display popups during peak engagement hours.
- Target by Device – Tailor designs for desktop, mobile, and tablet users.
- Test & Refine – Run A/B tests to validate improvements.
-
How to Access Analytics
- Go to: WordPress Admin → Instant Popup → Analytics
- Use:
- Dashboard – Quick performance overview
- AI Insights – Automated improvement suggestions
- Reports – In-depth performance data
- Export – Download analytics for offline analysis
Pro Tip: Review AI Insights regularly to adjust your popup strategy based on real-time user behavior.